Correlation, regression, matrices and scripts on my way to PhD at AMOLF Back to the articles Back to the articles Sun April 28, 2013, 21:22 | Sun April 28, 2013, 21:22 |  14715x | 14715x |  Feel free to leave a comment Feel free to leave a commentTopic: Science | Series: My Journey to PhD 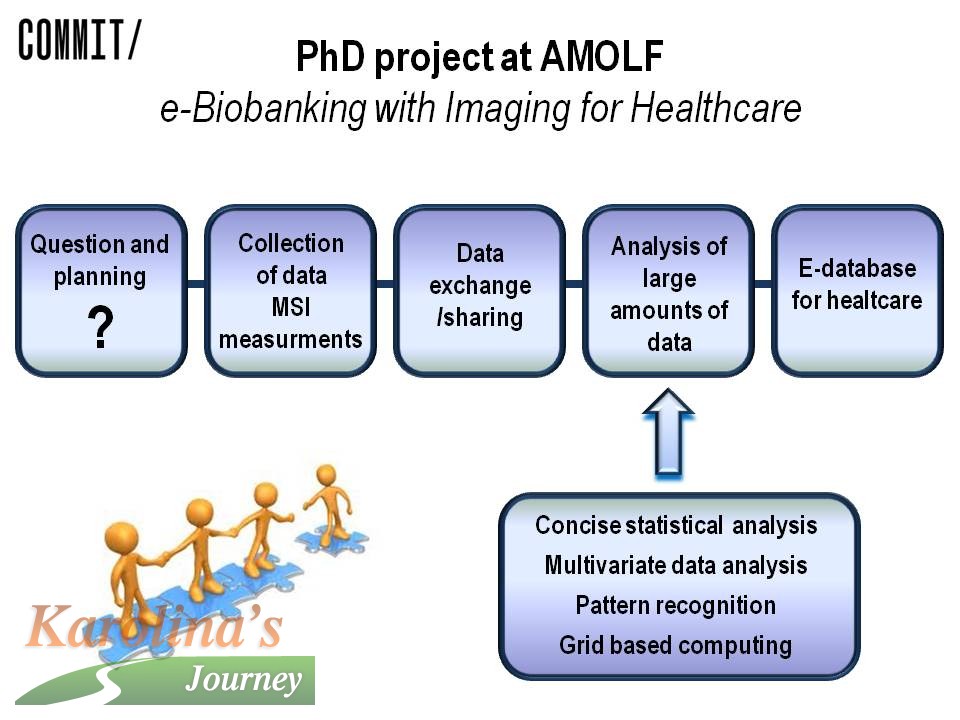 That is a random selection of some of the words that accompany me during my first spring in Amsterdam and at AMOLF. I spent two weeks in the Czech Republic earlier during April. I managed to visit the Faculty of Pharmacy in Hradec Kralove and to make all the arrangements necessary for the final moving to The Netherlands. I met also many of my friends, which was highly appreciated. Additionally I took part in a two-day course on MATLAB programming. Why? Let me explain in the following article. That is a random selection of some of the words that accompany me during my first spring in Amsterdam and at AMOLF. I spent two weeks in the Czech Republic earlier during April. I managed to visit the Faculty of Pharmacy in Hradec Kralove and to make all the arrangements necessary for the final moving to The Netherlands. I met also many of my friends, which was highly appreciated. Additionally I took part in a two-day course on MATLAB programming. Why? Let me explain in the following article. I have been an official PhD student at AMOLF since Mid-March this year. My supervisor at AMOLF is Ron Heeren, in whose group I have been already working since last year October. My second supervisor is from the Radboud University in Nijmegen and her name is Lutgarde Buydens. With the guidance of those two I should get to the doctoral degree. Lutgarde is a specialist on chemometrics, that is on a statistical evaluation of chemical data. It is a discipline of a particular importance not only in analytical chemistry. It is not enough to collect data, one also needs to understand, what they mean. That is sometimes not as easy as it sounds. Sometimes the data are just very complicated and the "true" significance is hidden. The sophisticated statistical tools represent an elegant way how to explain the data. To be able to apply the statistical tools, it gets very useful to know the programs for computing such as the above mentioned MATLAB. MATLAB is a computational environment, where various scripts and functions can be written. They can further be applied on the data measured and in the end help with the data interpretation. They help to find the connections and relations within a dataset. You might be wondering why do I explain all this stuff. Well, it is because the chemometrics and statistical data evaluation is going to be also a part of my PhD project, together with the data collection. My PhD project is called "E-biobanking with imaging for healthcare." And I will tell you more about it in the following paragraphs. At the beginning of any scientific project, there stands a question. In our case it might sound like this: "What is the molecular difference between breast tissue of a healthy woman and a breast cancer tissue?" (Molecular means what type of molecules can we find in those tissue types. For example which proteins or lipids.) Another question posed would be: "What is the molecular difference between the tumor tissue of a patient, who responds to therapy and of that who does not?" Or even another one: "What is the difference between the particular types of the breast cancers on the molecular level?" In the end of the project, we would like to have a vast electronic database of all those types of tissues. It should map all the differences between the patients and it should be possible to classify the patients accordingly. It should for example help to answer, whether a particular patient will or will not respond to a therapy with a specific treatment. (So called personalized medicine). Between the opening questions and the final database is, as you can probably imagine, huge amount of work. Not of a single person, not even of a single scientific group, but a load of work of many groups and many more people. The task requires co-operation of pathologist, biologist, chemists and also IT specialists. I am, at the moment, part of the chemistry group – I belong within analytical chemists, to be precise. I will be one of those who take care of the data collection, that is of tissue samples measurements. We will employ state-of-the-art mass spectrometry imaging for this purposes. I have already mentioned this technique earlier on this website. For example here. However, soon I should also start to participate on the data evaluation using appropriate statistical tools. That is why I am studying mathematics and statistics at the moment. My supervisor from Nijmegen and a colleague of her equipped me with a load of study materials. It is tough, but I actually enjoy it. Out of a sudden I can see, how the math works in practice and what is it all good for. Moreover, one has a perfect exercise for brain. Instead of solving Sudoku, you can simply multiply two matrices or calculate a derivative of a function. At the beginning it might seem as a task a way too big for a pharmacists. However, everything is possible if one is motivated enough and when one believe it enough. In the end, my supervisor Lutgarde also studied pharmacy and then obtained PhD in chemometrics. When she did it I will, too. :-) No comments. |
|

Photo No. 87: Fructus cynosbati (Open in new window), Author: , Date:
You are here: Karolinas.net » Home » » Correlation, regression, matrices and scripts on my way to PhD at AMOLF
 Česky
Česky English